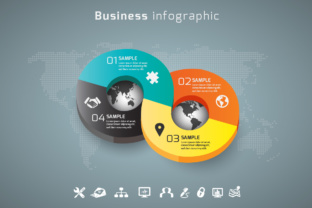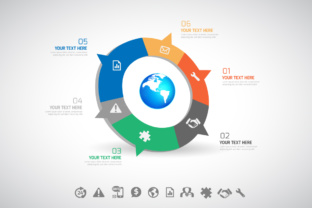
Circle Business Infographic
The Circle Business Infographic isn’t just another template—it’s a visual framework that mirrors how real business systems actually function: interconnected, cyclical, and interdependent. Unlike linear flowcharts or hierarchical org charts, it places core functions—like marketing, operations, customer experience, finance, and innovation—not as siloed steps, but as equally vital segments of a unified ring. This simple shift in layout invites clarity, reveals feedback loops, and makes relationships between activities immediately legible.
Why the Circle Format Works So Well
Our brains recognize circular patterns as natural, continuous, and balanced. That’s why the Circle Business Infographic resonates across industries and experience levels. It doesn’t assume a “start” or “end”—instead, it reflects how revenue fuels product development, which improves customer retention, which informs marketing strategy, which drives more revenue. No segment dominates; each supports and depends on the others.
This structure also resists oversimplification. You can layer in sub-elements (e.g., “customer feedback” inside the Experience segment, “cash flow forecasting” inside Finance) without cluttering the core message. It scales—from a solo freelancer mapping their weekly workflow to a 50-person SaaS team aligning quarterly OKRs.
Creative Applications Across Roles
Different users find distinct value in adapting the Circle Business Infographic—here’s how:
- Freelancers & solopreneurs use it to audit their own workflow: Is time spent on outreach (Marketing) matched by capacity in delivery (Operations)? Does client follow-up (Experience) close the loop—or drop off? A quick sketch reveals imbalances before they become burnout triggers.
- Small business owners adapt it for team onboarding. Instead of handing over a dense operations manual, they share a color-coded circle showing how inventory management (Operations) connects to social proof collection (Marketing), which feeds into pricing decisions (Finance). New hires grasp context—not just tasks.
- Educators & trainers build versions with student-facing language—e.g., “Research → Draft → Revise → Publish → Reflect” as a learning cycle. It teaches process thinking while modeling iteration over perfection.
- Bloggers & content creators map audience journeys: Discovery → Engagement → Trust → Conversion → Advocacy. Placing “Advocacy” next to “Discovery” visually reinforces how referrals feed back into growth—no funnel required.
Designing Your Own—Without Overcomplicating It
You don’t need design expertise to make an effective Circle Business Infographic. Start with purpose, not polish:
- Define your core 4–6 functions. Be specific: “Lead Nurturing” beats “Marketing”; “Support Ticket Resolution” is clearer than “Customer Service.”
- Arrange them logically—but don’t stress about “correct” order. What matters is showing adjacency where collaboration happens (e.g., place “Product Feedback” next to “Development”).
- Add minimal connecting cues. Arrows between segments? Optional. Dotted lines showing data flow? Helpful—if they clarify, not decorate. If in doubt, leave them out.
- Use consistent visual weight. Same font size, same icon style (or no icons), same level of detail per segment. Uneven treatment distracts from relationships.
A hand-drawn version on a whiteboard, photographed and shared in a Slack update, often lands better than a pixel-perfect slide no one reads.
Variations That Serve Real Needs
The power lies in adaptation—not replication. Try these grounded variations:
- The Priority Circle: Size each segment proportionally to time, budget, or strategic focus (e.g., a bootstrapped startup might enlarge “Cash Flow Management” while shrinking “Brand Campaigns”). Visually communicates trade-offs without jargon.
- The Maturity Circle: Use color intensity or checkmarks to show development stage—e.g., “Team Onboarding Process” at 30% completion vs. “Client Retention System” at 90%. Great for internal progress tracking.
- The Platform-Specific Circle: Recreate the same core structure for different formats: a carousel post (one segment per slide), a Notion dashboard (clickable segments linking to docs), or a laminated wall chart in a co-working space.
Keeping It Useful—Not Just Pretty
An infographic fails when it’s admired but not used. To avoid that:
Anchor each segment to action. Instead of labeling a section “Growth,” ask: What’s one concrete thing we do here this quarter? Example: “Run two A/B tests on email subject lines” or “Add exit-intent survey to pricing page.” That turns the circle from illustration to checklist.
Update it regularly—but lightly. Revisit every 6–8 weeks. Did a new tool change how support tickets flow? Does a recent customer interview reveal a missing link between “Sales Follow-Up” and “Onboarding”? Adjust one segment. Don’t rebuild the whole ring.
And remember: it’s okay for your Circle Business Infographic to be imperfect. The first version should take under 30 minutes. Its value multiplies through use—not through aesthetic refinement.
Ideas to Spark Your Next Version
Stuck on where to begin? Try one of these low-lift prompts:
- Map your last successful project backward: What triggered it? What supported it? What sustained it? Place those as segments.
- Sketch how your ideal client moves through your offering—not as a funnel, but as a loop. Where do they re-enter? Where do they pause?
- Compare your current circle to one from 12 months ago. Which segments grew? Which shrunk? What does that say about where energy went—and where it’s needed now?
None require software, budget, or approval. They only require noticing what’s already happening—and giving it shape.
The Circle Business Infographic endures because it meets people where they are: not as abstract “businesses,” but as humans managing complexity with limited time and attention. It doesn’t promise transformation—it offers orientation. And from that clarity, better decisions, smoother workflows, and more intentional growth naturally follow.